A guide to documenting, profiling and debugging Nim code
02 October 2017 Dominik Picheta
This guide will discuss some of the useful tools for documenting, profiling and debugging Nim code. Some of the things you will be introduced to include:
-
The reStructuredText language which is used in Nim’s doc comments
-
The Nim performance and memory usage profiler
-
Using GDB/LLDB with Nim
Be sure to have a Nim compiler ready and follow along with the instructions in this guide to get the most out of it.
1. Documenting your code
Code documentation is important. It explains details about software which may not be immediately apparent when looking at the API of libraries or even the software’s source code.
There are many ways to document code. You like already know that, like many programming languages, Nim supports comments. Comments act as an annotation for source code, a way to make code easier to understand.
In Nim a single-line comment is delimited by a hash character #.
Multi-line comments can be delimited by #[ and ]#.
Listing 1.1 shows an example of both.
var x = 5 # Assign 5 to x.
#[multi-
  line      (1)
comment]#| 1 | This syntax is still relatively new and so most syntax highlighters are not aware of it. |
Nim also supports a special type of comment, called a documentation comment.
This type of comment is processed by Nim’s documentation generator. Any comment
using two hash characters ## is a documentation comment.
## This is a *documentation comment* for module ``test``.Listing 1.2 shows a very simple documentation comment.
The Nim compiler
includes a command to generate documentation for a given module. Save the code
in Listing 1.2 as test.nim somewhere on your file system then
execute nim doc test.nim. A test.html file should be produced beside
your test.nim file. Open it in your favourite web browser to see the
generated HTML. You should see something similar to the screenshot in
figure 1.1.

test.nim moduleNote the different styles of text seen in the screenshot. The text
"documentation comment" is in italics because it is surrounded by asterisks
(*) in the doc comment. The "test" is surrounded by two backticks which makes
the font monospaced, useful when talking about identifiers such as variable
names.
These special delimiters are part of the reStructuredText markup language which the documentation generator supports. The documentation generator reads the file you specify on the command-line, it finds all the documentation comments and then goes through each of them. Each documentation comment is parsed using a reStructuredText parser. The documentation generator then generates HTML based on the reStructuredText markup that it parses.
Table 1.1 shows some example syntax of the reStructuredText markup language.
| Syntax | Result | Usage |
|---|---|---|
|
italics |
Emphasising words weakly |
|
bold |
Emphasising words strongly |
|
|
Identifiers: variable, procedure, etc. names. |
|
Linking to other web pages. |
|
|
|
The |
echo("Hello World")
|
|
To show some example code. This will add syntax highlighting to the code specified. |
For a more comprehensive reference take a look at the following link: http://sphinx-doc.org/rest.html
Let me show you another example.
## This is the best module in the world.
## We have a lot of documentation!
##
##
## Examples
## ========
##
## Some examples will follow:
##
##
## Adding two numbers together
## ---------------------------
##
## .. code-block:: nim
##
##   doAssert add(5, 5) == 10
##

proc add*(a, b: int): int =
  ## Adds integer ``a`` to integer ``b`` and returns the result.
  return a + b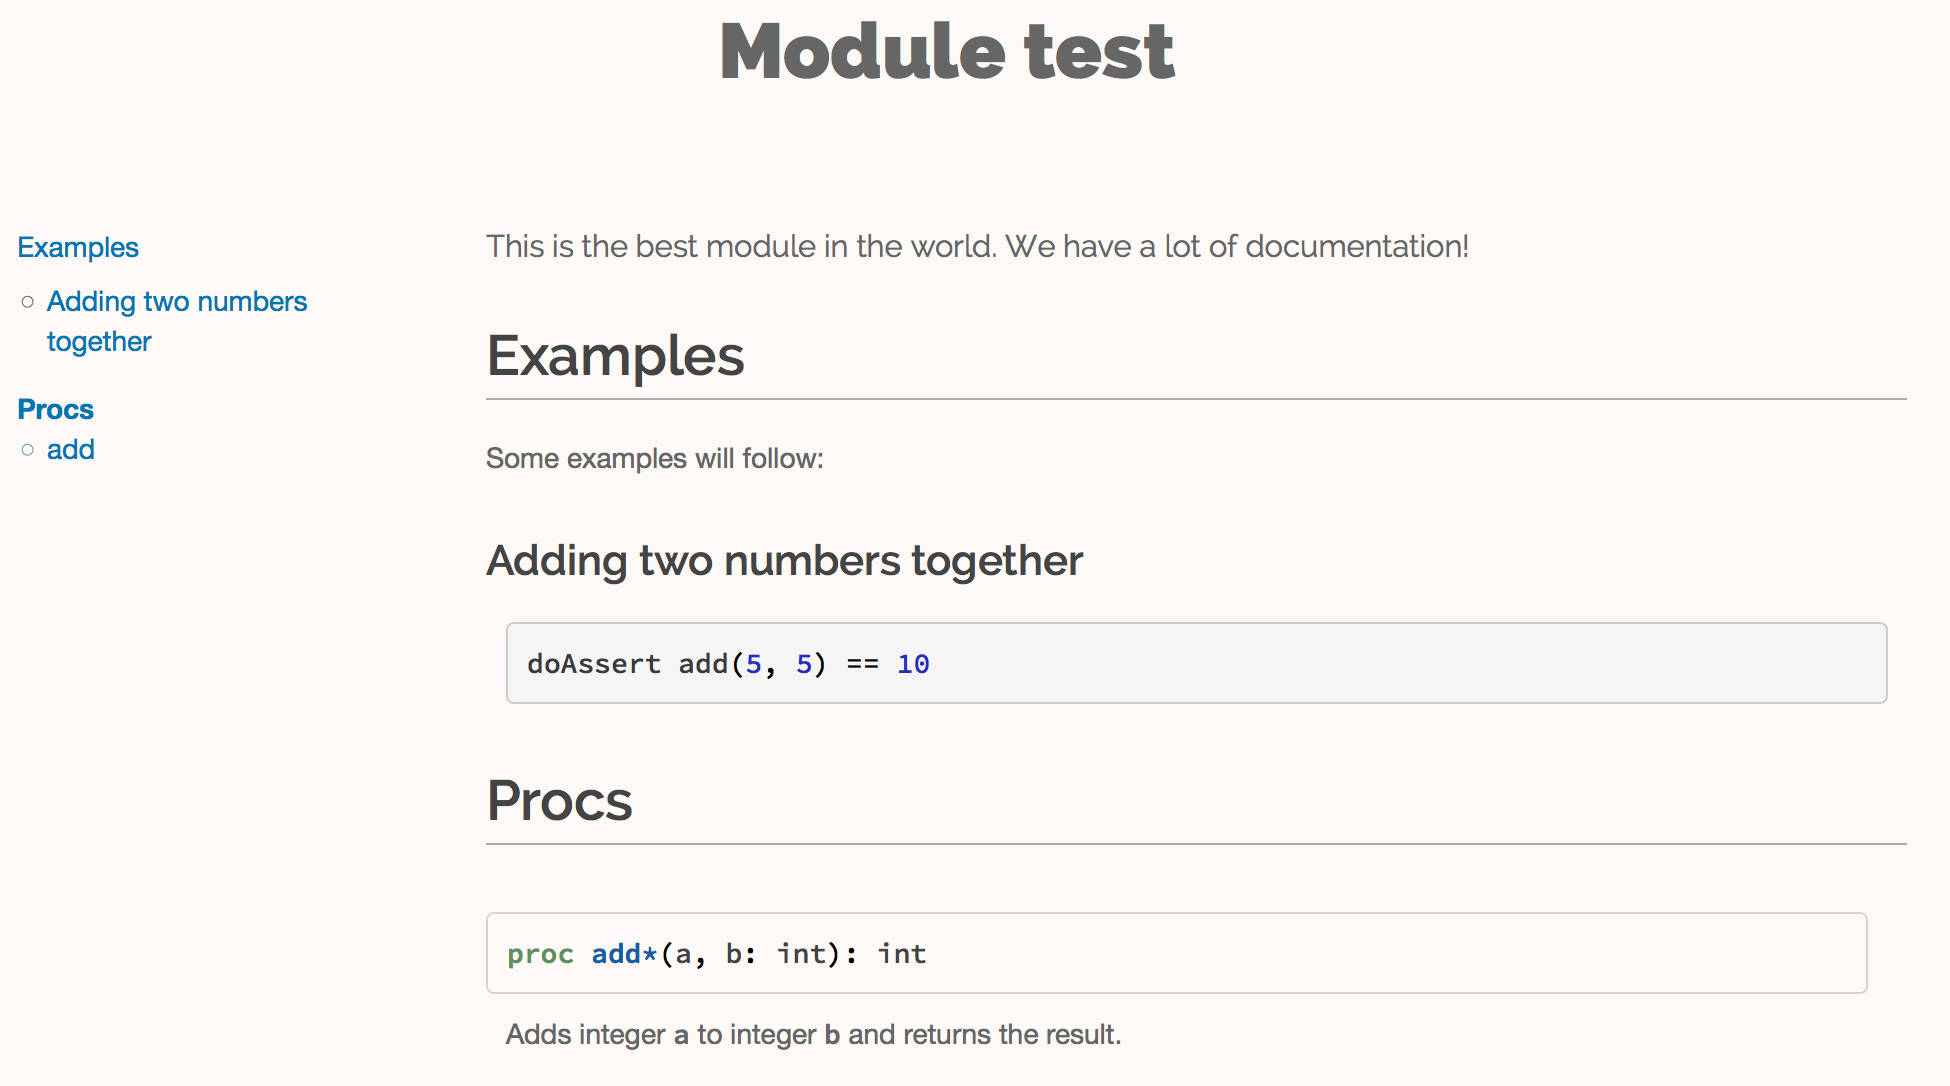
As you can see from the example in listing 1.3, documentation comments can be placed in many places. They can be in the global scope or locally under a procedure. Doc comments under a procedure document what that procedure does, the Nim documentation generator generates a listing of all procedures that are exported in a module, the ones that have documentation comments will display them underneath as shown in figure 1.2.
This is how the Nim standard library is documented. For more examples on how to document your code you should take a look its source code.
2. Profiling your code
Profiling an application is the act of analysing it at runtime to determine what it spends its time doing. For example, in which procedures it spends most of its time, or how many times each procedure is called. These measurements help to find areas of code which need optimisation. Occasionally they can also help you find bugs in your application.
There is a large amount of profilers available for the Nim programming language. This may come as a surprise because Nim is a relatively new language. The fact is that most of these profilers have not been created specifically for Nim but for C. C profilers support Nim applications because Nim compiles to C. There are only a few things that you need to know to take advantage of such profilers.
There is one profiler that is actually included with the Nim compiler, it is so far the only profiler designed for profiling Nim applications. Let’s take a look at it before moving to the C profilers.
2.1. Profiling with nimprof
The Embedded Stack Trace Profiler (ESTP), or sometimes just called NimProf, is a Nim profiler included with the standard Nim distribution. To activate this profiler you only need to follow the following steps:
-
Import the
nimprofmodule in your program’s main Nim module (the one you will be compiling), -
Compile your program with the
--profiler:onandstacktrace:onflags. -
Run your program as usual.
|
Application speed
As a result of the profiling your application will run slower, this is
because the profiler needs to analyse your application’s execution at
runtime which has an obvious overhead.
|
Consider the following code listing.
import nimprof (1)
import strutils (2)

proc ab() =
  echo("Found letter")

proc num() =
  echo("Found number")

proc diff() =
  echo("Found something else")

proc analyse(x: string) =
  var i = 0
  while i < x.len:
    case x[i] (3)
    of Letters: ab()
    of {'0' .. '9'}: num()
    else: diff()
    i.inc

for i in 0 .. 10000: (4)
analyse("uyguhijkmnbdv44354gasuygiuiolknchyqudsayd12635uha")| 1 | The nimprof module is essential in order for the profiler to work. |
| 2 | The strutils module defines the Letters set. |
| 3 | Each character in the string x is iterated over, if a character is a
letter then ab is called, if it’s a number then num is called, and
if it’s something else then diff is called. |
| 4 | We perform the analysis 10 thousand times in order to let the profiler measure reliably. |
Save it as main.nim, then compile it by executing
nim c --profiler:on --stacktrace:on main.nim. The example should compile
successfully. You may then run it. After the program has finished executing
you should see a message similar to "writing profile_results.txt…" appear
in your terminal window.
The main program should create a profile_results.txt file in your current
working directory. The file’s contents should be similar to those in
listing 1.5.
total executions of each stack trace:
Entry: 1/4 Calls: 89/195 = 45.64% [sum: 89; 89/195 = 45.64%]
  analyse 192/195 = 98.46%
  main 195/195 = 100.00%
Entry: 2/4 Calls: 83/195 = 42.56% [sum: 172; 172/195 = 88.21%]
  ab 83/195 = 42.56%
  analyse 192/195 = 98.46%
  main 195/195 = 100.00%
Entry: 3/4 Calls: 20/195 = 10.26% [sum: 192; 192/195 = 98.46%]
  num 20/195 = 10.26%
  analyse 192/195 = 98.46%
  main 195/195 = 100.00%
Entry: 4/4 Calls: 3/195 = 1.54% [sum: 195; 195/195 = 100.00%]
  main 195/195 = 100.00%
While the application is running the profiler takes multiple snapshots of the
line of code that is currently being executed. It notes the stack trace which
tells it how the application ended up executing that piece of code. The most
common code paths are then reported in profile_results.txt.
In the report shown in listing 1.5,
the profiler has made 195 snapshots.
It found that the line of code being executed was inside the analyse
procedure in 45.64% of those snapshots. In 42.56% of those snapshots it was
in the ab procedure, this makes sense because the string passed to
analyse is mostly made up of letters. Numbers are less popular and so
the execution of the num procedure only makes up 10.26% of those snapshots.
The profiler did not pick up any calls to the diff procedure because there
are no other characters in the x string. Try adding some punctuation to
the string passed to the analyse procedure and you will find that the
profiler results then show the diff procedure.
It is easy to determine where the bulk of the processing takes place in listing 1.4 without the use of a profiler. But for more complex modules and applications the Nim profiler is great for determining which procedures are most used.
|
Memory usage
The Nim profiler can also be used for measuring memory usage, simply
compile your application with the --profiler:off, --stackTrace:on,
and -d:memProfiler flags.
|
2.2. Profiling with Valgrind
Unfortunately in some cases profilers are not cross-platform. Valgrind is one of those cases, if you are a Windows user then I’m afraid you will not be able to use it.
Valgrind is not just a profiler, it is primarily a tool for memory debugging and memory leak detection. The profiler component is called Callgrind and it analyses procedures that your application calls and what those procedures then call and so on. An application called KCacheGrind can visualise output from Callgrind.
|
Installing Valgrind
To follow along with the examples here you will need to install the
Valgrind tool together with KCacheGrind. There is a chance these tools
are already installed on your operating system if you are using Linux.
On Mac OS X you can easily install them using Homebrew, just execute
brew install valgrind QCacheGrind.
|
Let’s try Valgrind on the example application in listing 1.4.
First recompile the
application without any flags by running nim c main. You
will need to comment out the import nimprof line in your main.nim file
to do this successfully.
You may then execute the following
command to run this application under
Valgrind: valgrind --tool=callgrind -v ./main
The callgrind tool adds an even bigger overhead than the Nim profiler so you may need to terminate the application, you can safely do so by pressing the Control and C keys together.
The textual output given by the callgrind tool is very large and so looking at it all in a text editor is impractical. Thankfully a tool exists to allow us to explore it visually. This tool is called KCacheGrind (QCacheGrind on Mac OS X). You can execute it in the directory where you executed Valgrind to get something similar to the screenshot in figure 1.3.
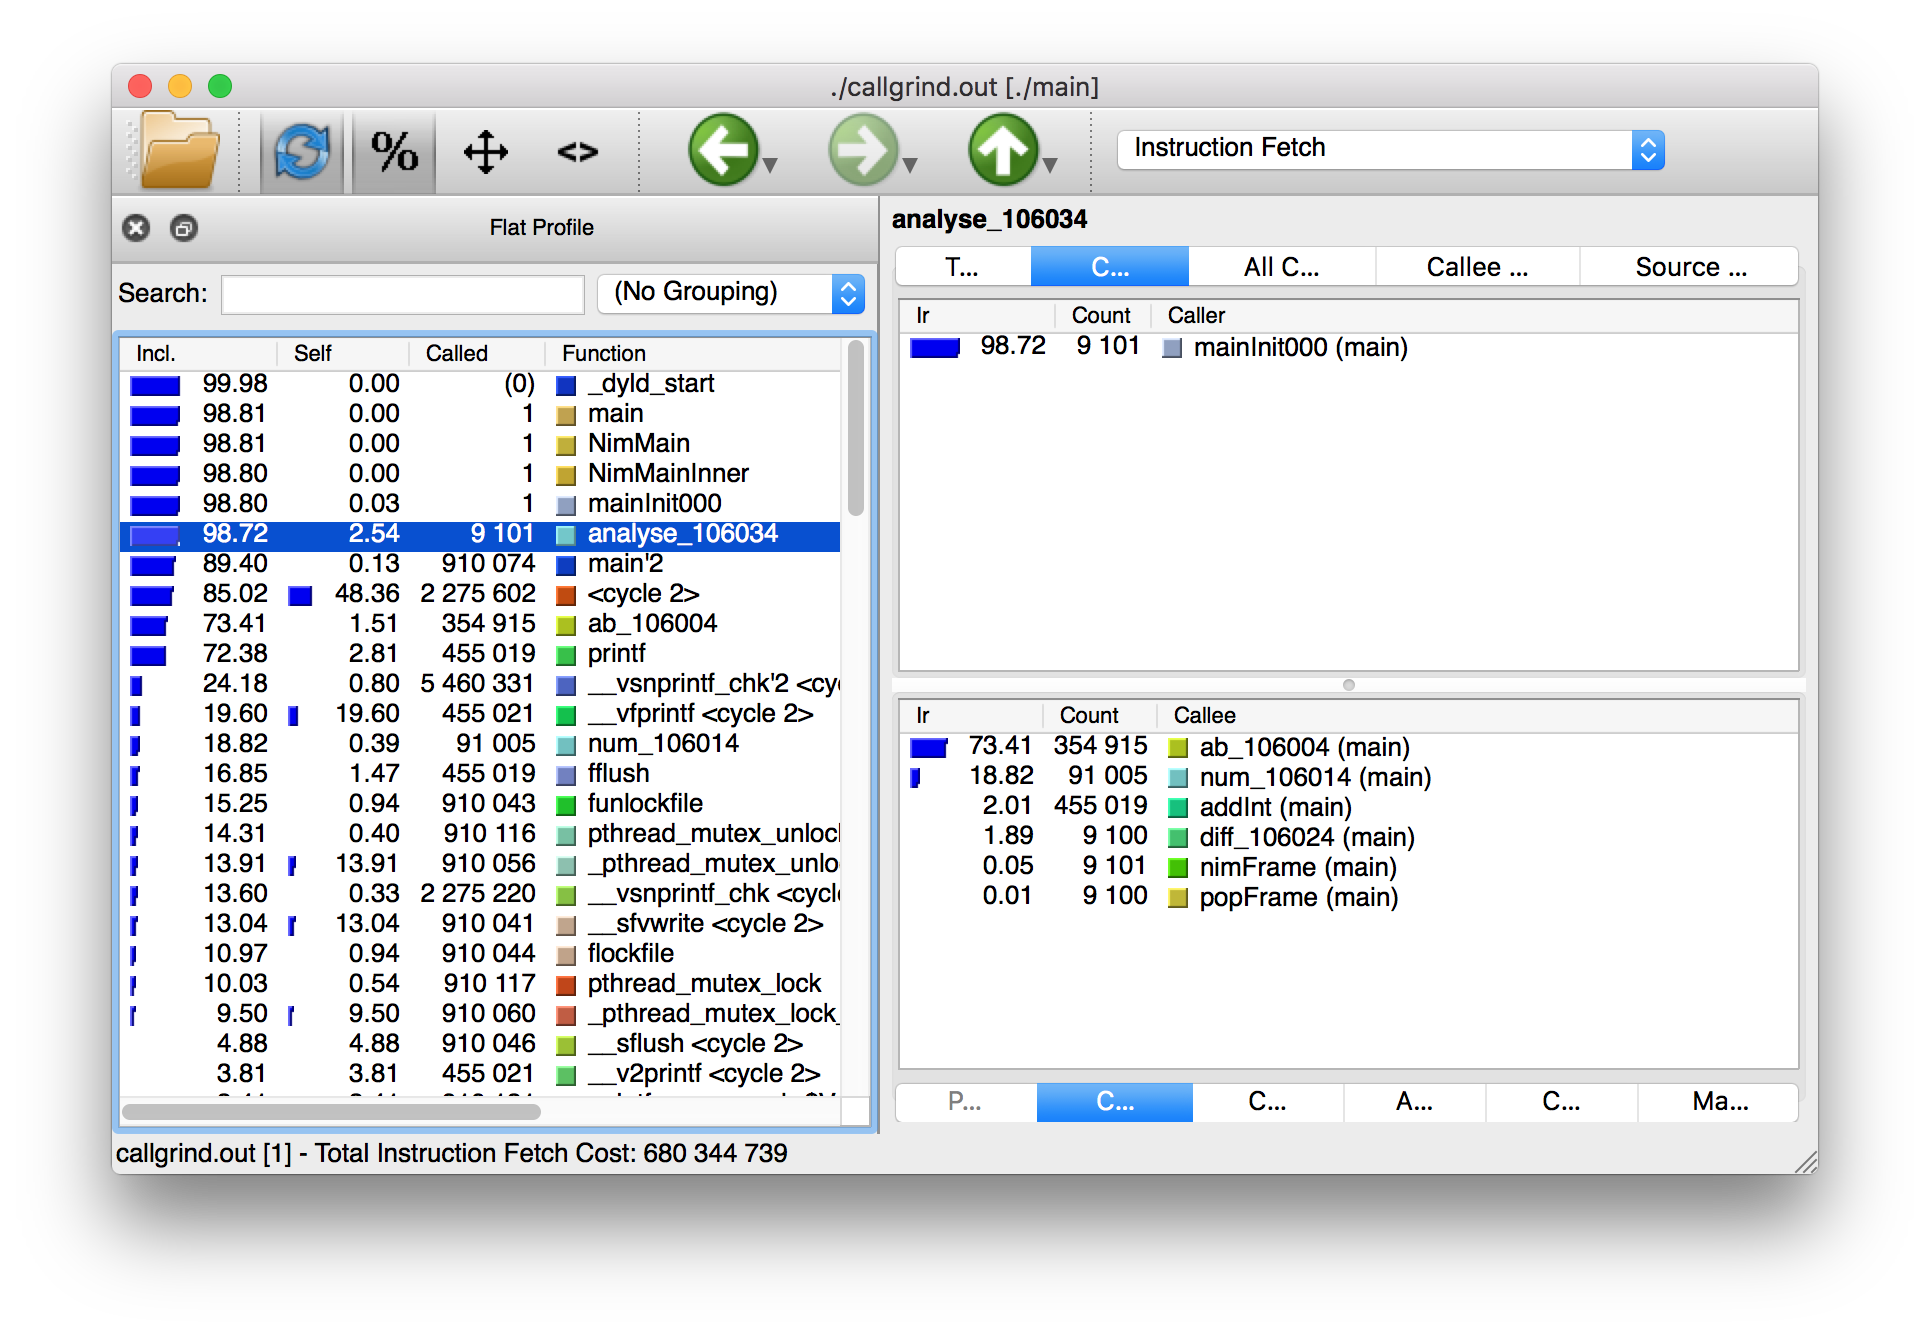
The results of the Callgrind tool show many more calls during the lifetime of listing 1.4. This is because many of the C functions, which have been defined by Nim, during the translation to C are now visible. These functions are necessary to implement the behaviour of the code in listing 1.4.
The C function which is selected in the screenshots corresponds to the
analyse Nim procedure. Procedures' names undergo a process called name
mangling when translated to C functions, this prevents clashes between other
C functions. The name mangling process currently just adds an underscore
followed by a number to the C function name. Thankfully figuring out which
C functions correspond to which Nim procedures is still easy.
The output from Callgrind gives you more low-level details about the execution of your Nim applications. Figure 1.3 shows the number of times every single C function has been executed, it allows you to diagnose performance problems which may be outside your control. But with greater power comes greater complexity so Valgrind has a higher learning curve than the Nim profiler.
3. Debugging Nim code
Debugging is one of the most important activities in software development. Bugs in software occur inadvertantly. When a user reports an issue with your software, how do you fix it?
The first step is to reproduce the issue. After that debugging tools help to diagnose the issue and to figure out its root cause.
Nim does many things to make debugging as easy as possible. For example it ensures that detailed and easy to understand stack traces are reported whenever your application crashes. Consider the following code in listing 1.6.
import strutils (1)
let line = stdin.readLine() (2)
let result = line.parseInt + 5 (3)
echo(line, " + 5 = ", result) (4)| 1 | The strutils module defines the parseInt procedure. |
| 2 | Read a line from the standard input. |
| 3 | The string line is converted into an integer, the number 5 is then
added to that integer. |
| 4 | Display the result of the calculation. |
This code is fairly simple. It reads a line of text from the standard input,
converts this line into an integer, adds the number 5 to it and displays
the result. Save this code as adder.nim and compile it by executing
nim c adder.nim, then execute the resulting binary. The program will
wait for your input, once you type in a number you will see the sum of 5
and the number you typed in. But what happens when you don’t type in a number?
Type in some text and observe the results. You should see something similar
to the output in listing 1.7 below.
ValueError exceptionTraceback (most recent call last)
adder.nim(3) adder (1)
strutils.nim parseInt (2)
Error: unhandled exception: invalid integer: some text [ValueError] (3)| 1 | The program was executing line 3 in the adder module… |
| 2 | … followed by the parseInt procedure which raised the ValueError
exception. |
| 3 | This is the exception message followed by the exception type in square brackets. |
The program crashed because an exception was raised and it was not caught
by any try statements. This resulted in a stack trace being displayed and
the program exiting. The stack trace in listing 1.7 is
very informative,
it leads directly to the line which caused the crash. After the adder.nim
module name, the number 3 points to the line number
in the adder module. This line is highlighted in
listing 1.8 below.
import strutils
let line = stdin.readLine()
let result = line.parseInt + 5
echo(line, " + 5 = ", result)
The parseInt procedure cannot convert strings containing only letters
into a number because no number exists in that string. The exception message
shown at the bottom of the stack trace informs us of this. It includes
the string value that parseInt attempted to parse which gives further hints
about what went wrong.
You may not think it but program crashes are a good thing when it comes to debugging. The truly horrible bugs are the ones which produce no crashes, but instead result in your program producing incorrect results. In such cases advanced debugging techniques need to be used. Debugging also comes in handy when a stack trace does not give enough information about the issue.
The primary purpose of debugging is to investigate the state of memory
at a particular point in the execution of your program. You may for example
want to find out what the value of the line variable is just before
the parseInt procedure is called. This can be done in many ways.
3.1. Debugging using echo
By far the simplest and most common approach is to use the echo
procedure. The echo
procedure allows you to display the value of most variables, as long as the
type of the variable implements the $ procedure it can be displayed.
For other variables the repr procedure can be used, you can pass any
type of variable to it and get a textual representation of that
variable’s value.
Using the repr procedure and echo, let’s investigate the value of the
line variable just before the call to parseInt.
line variable using repr.import strutils
let line = stdin.readLine()
echo("The value of the line variable is: ", repr(line))
let result = line.parseInt + 5
echo(line, " + 5 = ", result)The repr procedure is useful because it shows non-printable characters
in their escaped form. It also shows extra information about many types of
data. Running the example in listing 1.9 and typing in 3 Tab
characters results in the following output.
The value of the `line` variable is: 0x105ff3050"\9\9\9"
Traceback (most recent call last)
foo.nim(4)               foo
strutils.nim             parseInt
Error: unhandled exception: invalid integer:       [ValueError]
The exception message just shows some whitespace which is how Tab characters
are shown in normal text. But you have no way of distinguishing whether
that whitespace is just normal space characters or whether it is in fact a
multiple Tab characters. The repr procedure solves this ambiguity by showing
\9\9\9, the number 9 is the ASCII number code for the tab character.
The memory address of the line variable is also shown.
3.2. Using writeStackTrace
An unhandled exception is not the only way for a stack trace to be displayed. You may find it useful to display the current stack trace anywhere in your program for debugging purposes. This can give you vital information, especially in larger programs with many procedures, where it can show you the path through those procedures and how your program’s execution ended in a certain procedure.
Consider the following example.
writeStackTrace exampleproc a1() =
writeStackTrace()
proc a() =
a1()
a()Compiling and running this example will display the following stack trace.
Traceback (most recent call last)
foo.nim(7)               foo
foo.nim(5)               a
foo.nim(2)               a1
The a procedure is called first on line 7, followed by a1 at line 5,
and finally the writeStackTrace procedure is called on line 2.
3.3. Using GDB/LLDB
Sometimes a proper debugging tool is necessary for the truly complicated issues. As with profiling tools in the previous section, Nim programs can be debugged using most C debuggers. One of the most popular debugging tools is the GNU Debugger, its often known by the acronym GDB.
The GNU debugger should be included with your distribution of gcc which you should already have as part of your Nim installation. Unfortunately on the latest versions of Mac OS X installation of gdb is problematic, but you can use a similar debugger called LLDB. LLDB is a much newer debugger, but it functions in almost exactly the same way.
Let’s try to use GDB (or LLDB if you’re on Mac OS X) to debug the small
adder.nim example introduced in listing 1.8.
I will repeat the example below.
adder.nim exampleimport strutils
let line = stdin.readLine()
let result = line.parseInt + 5
echo(line, " + 5 = ", result)In order to use these debugging tools you will need to compile adder.nim
with two additional flags. The --debuginfo flag, which will instruct the
compiler to add extra debugging information to the resulting binary. The
debugging information will be used by GDB and LLDB to read procedure names
and line numbers of the currently executed code.
And also the --linedir:on flag which will include Nim-specific debug
information
such as module names and Nim source code lines. GDB and LLDB will use the
information added by the --linedir:on flag to report Nim-specific module
names and line numbers.
Putting both of these together you should compile the adder module using the
following command: nim c --debuginfo --linedir:on adder.nim.
|
The
Newer versions of Nim support the --debugger:native flag--debugger:native flag which is
equivalent to specifying the --linedir:on and --debuginfo flags.
|
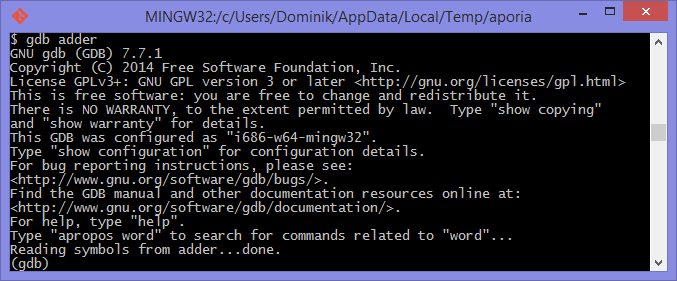
The next step is to launch the debugging tool. The usage of both of these tools
is very similar. To launch the adder executable in GDB execute gdb adder
and to launch it in LLDB execute lldb adder. GDB or LLDB should launch
and you should see something similar to figure 1.4
or figure 1.5.

Once these tools are launched they will wait for input from the user.
The input is in the form of a command. Both of these tools support a range
of different commands for controlling the execution of the program, to watch
the values of specific variables, to set breakpoints and much more. To get a
full list of supported commands type in help and press enter.
The aim for this debugging session is to find out the value of the line
variable, just like in the
previous sections. To do this we need to set a breakpoint at line 3 in the
adder.nim file. Thankfully, both GDB and LLDB share the same command syntax
for creating
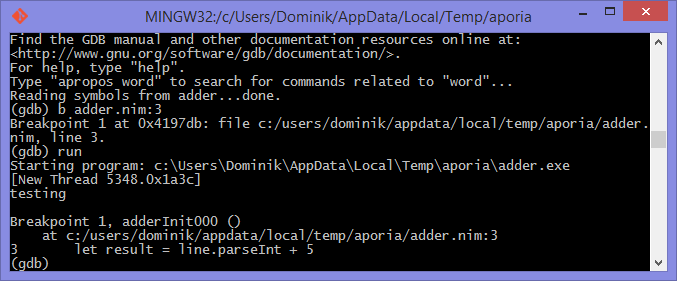
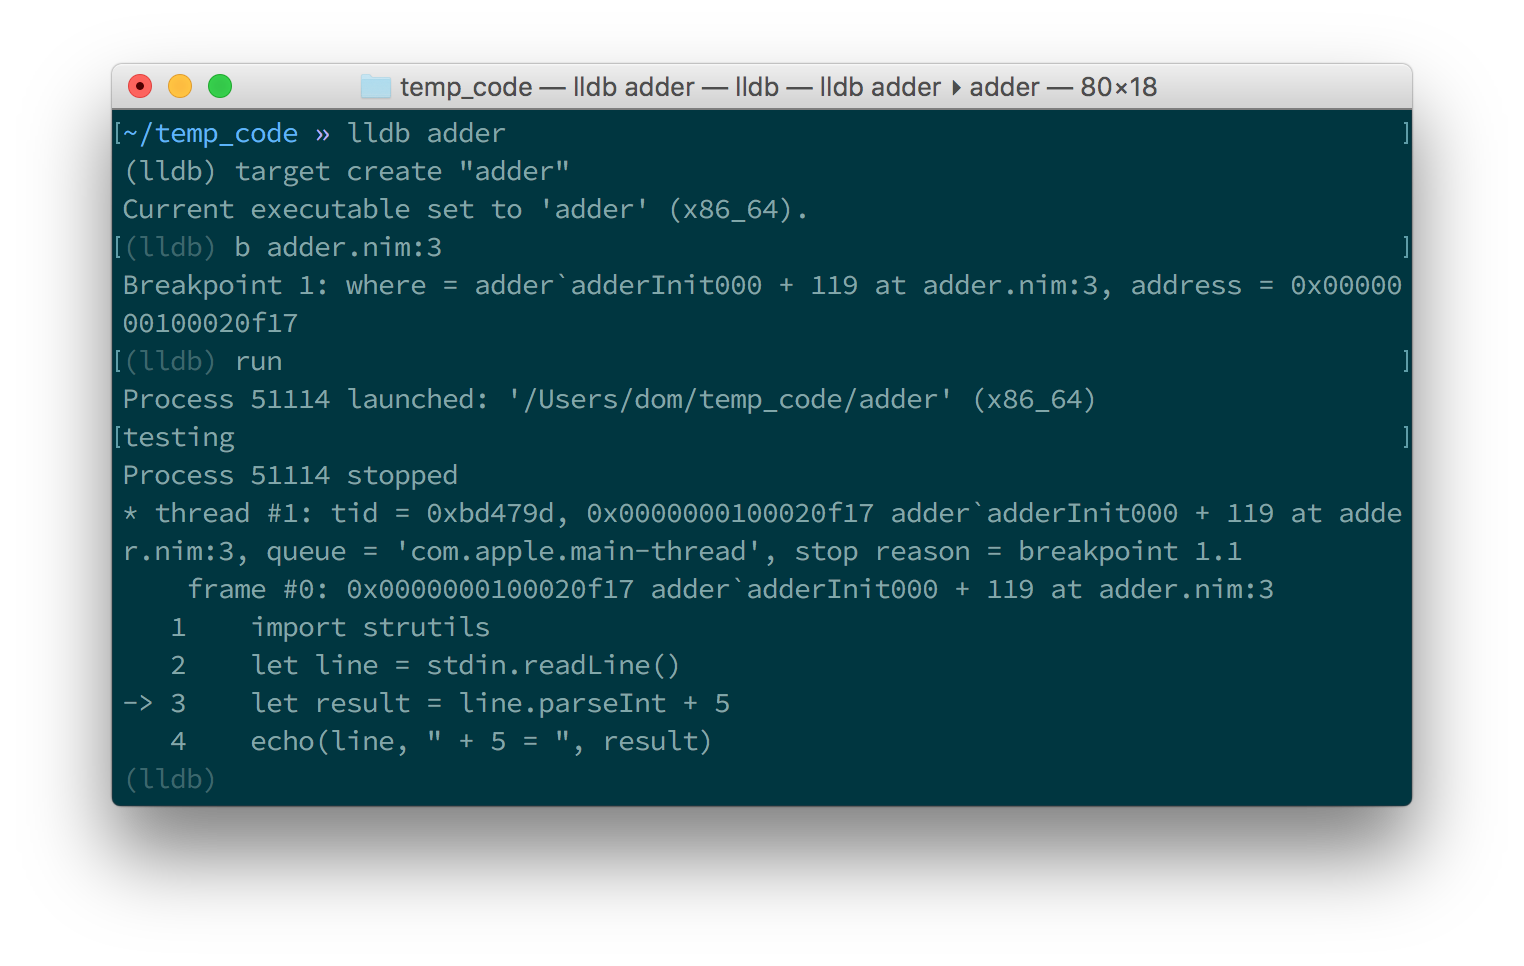
breakpoints. Simply type in b adder.nim:3 into the terminal and press enter.
A breakpoint should be successfully created, the debugger will confirm this
by displaying a message that is similar to Listing 5.23.
Breakpoint 1: where = adder`adderInit000 + 119 at adder.nim:3, address = 0x0000000100020f17Once the breakpoint is created, you can instruct the debugger to run the
adder program by using the run command. Type in run into the terminal
and press enter. The program won’t hit the breakpoint because it will first
read a line from standard input, so after you use the run command you will
need to type something else into the terminal. This time the adder program
will read it.
The debugger will then stop the execution of the program at line 3. Figures 1.6 and 1.7 show what that will look like.
At this point in the execution of the program, we should be able to display the
value of the line variable.
Displaying the value of a variable is the same in
both GDB and LLDB.
One can use the p (or print) command to display the value of any variable.
Unfortunately you cannot simply type in print line and get the result.
This is because of name mangling which I mentioned in the profiling section.
Before you can print out the value of the line variable you will need to
find out what the new name of it is. In almost all cases the variable name will
only have an underscore followed by a randomised number appended to it.
This makes finding the name rather trivial, but the process differs between
GDB and LLDB.
In GDB it is simple
to find out the name of the line variable, you can simply type in
print line_
and press the Tab button. GDB will then auto-complete the name for you, or give
you a list of choices.
As for LLDB, because it does not support auto-complete via the Tab key, this
is a bit more complicated. You need to find the name of the variable by looking
at the list of local and global variables in the current scope. You can get
a list of local variables by using the fr v -a
(or frame variable --no-args) command, and a list of global variables
by using the ta v (or target variable) command. The line variable is
a global variable so type in ta v to get a list of the global variables.
You should see something similar to the screenshot in figure 1.8.
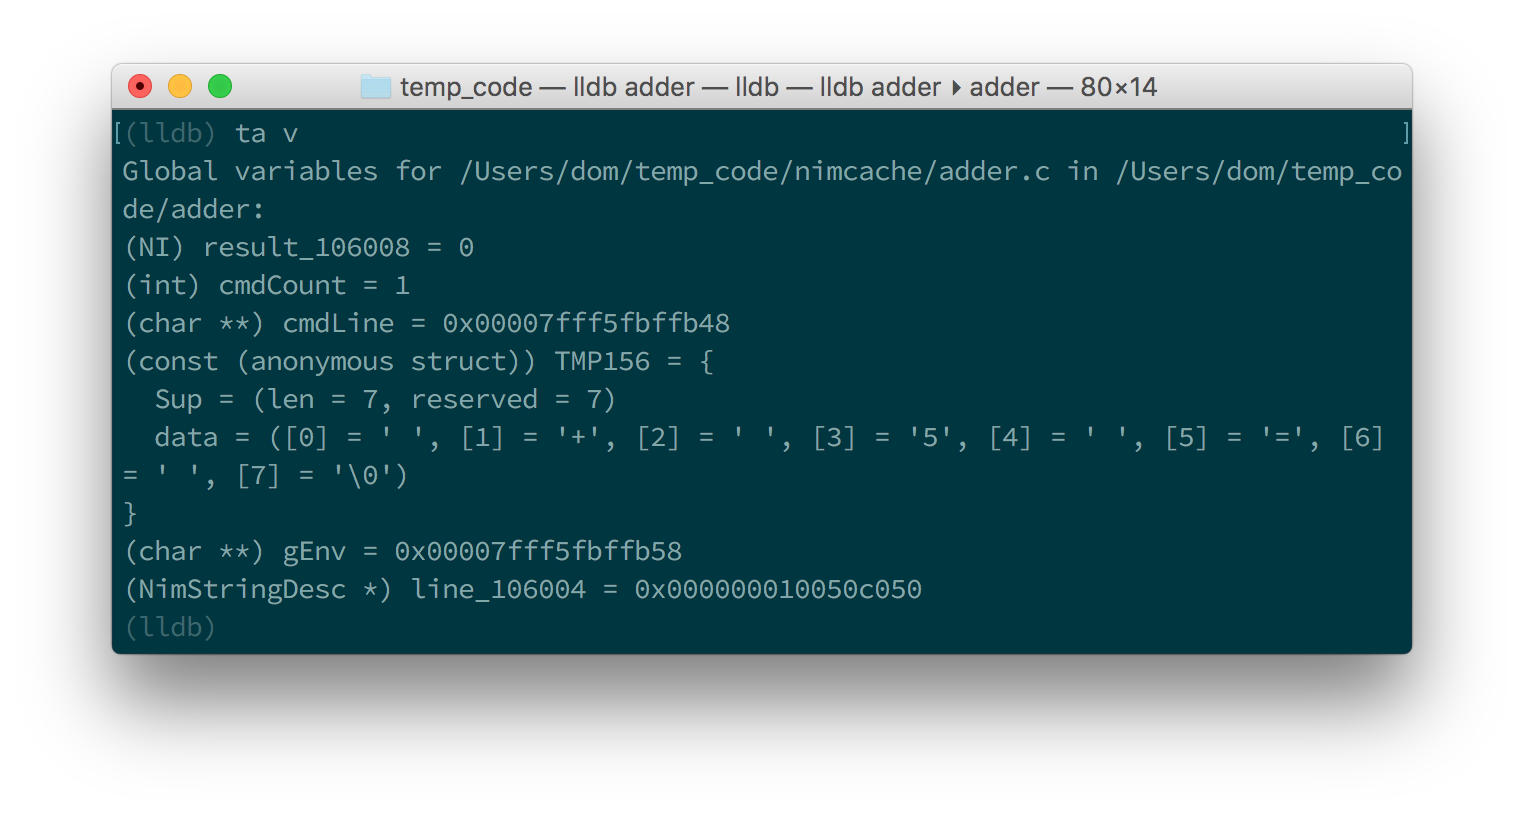
You can see the line variable at the bottom of the list as line_106004.
Now print the line variable by using the print <var_name_here> command,
make sure to replace the <var_name_here> with the name of the line variable
that you found from the previous step. Figures 1.9 and
1.10 show what you may see.

line variable in GDB
line variable in LLDBThis unfortunately tells us nothing about the value of the line variable.
We are in the land of low-level C, so the line variable is a pointer to
a NimStringDesc type. We can dereference this pointer by appending an
asterisk to the beginning of the variable name: print *line_106004.
Doing this will show values of each of the fields in the NimStringDesc
type. Unfortunately in LLDB this does not show the value of the data field,
so we must explicitly access it: print (char*)line_106004->data. The
(char*) is required to cast the data field into something which LLDB
can display. Figures 1.11 and 1.12
show what this looks like in GDB and LLDB respectively.

line variable in GDB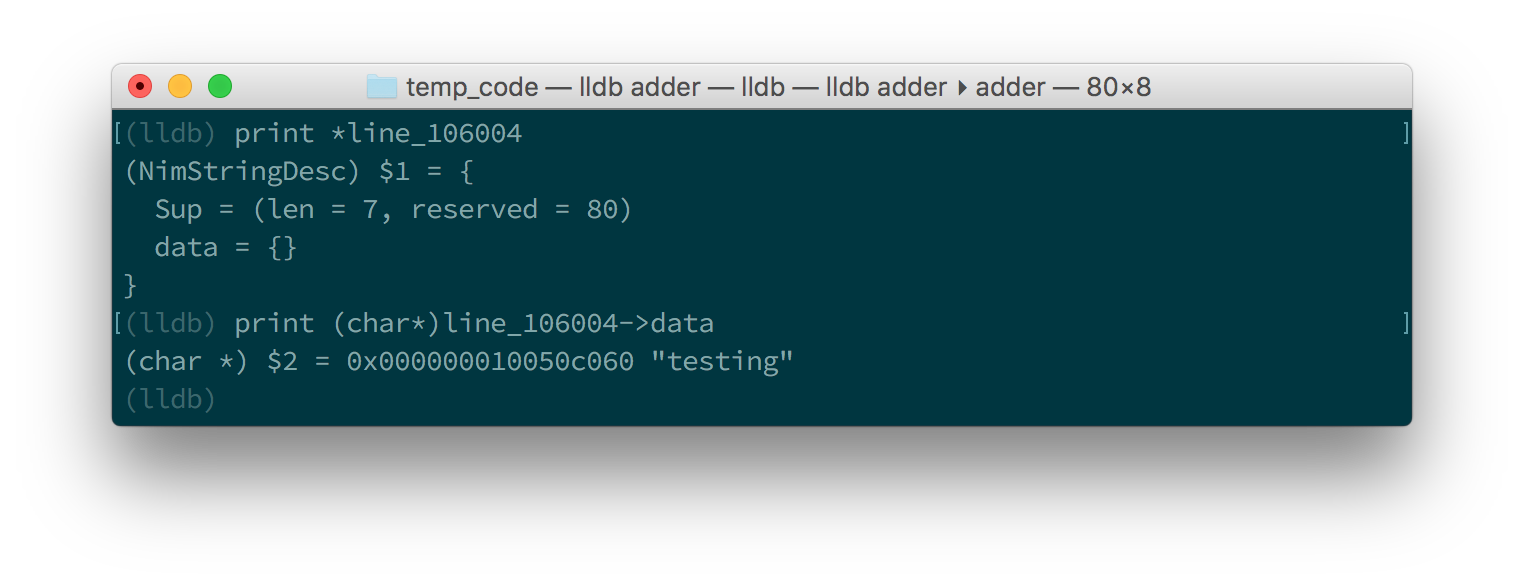
line variable in LLDBThis is much more complicated than simply using the echo procedure, but should
be useful for more complicated debugging scenarios. Hopefully this gave you
an idea of how to compile your Nim program so that it can
be debugged using GDB and LLDB. There are many more features that
these debuggers provide which are beyond the scope of this article. These
features allow you to analyse the execution of your program in many other
ways. You may wish
to learn more by looking at the many resources available online for these
debuggers and many others.
4. Conclusion
Thank you for reading. If you require help with these topics or anything else related to Nim, be sure to get in touch with our community.

